Custom AI Dashboards for Your Business
Your data is scattered across ten different platforms and nobody has a clear picture of what is actually working. I build bespoke AI dashboards that pull everything into one live view, in your branding, showing exactly the metrics that matter to you.
Book a Discovery CallWhy Your Business Dashboard Is Not Working
I hear the same story from almost every business I talk to. The data exists, but nobody can see it properly. Here is what that actually looks like.
You are paying for tools you barely use
You signed up for Power BI or Tableau because someone said you needed it. Now you are paying monthly licence fees for a tool that shows you approximately what you need, configured by someone who left six months ago. If you are looking for a Power BI alternative or a Tableau alternative that actually fits your business, the problem is not the tool. It is the approach.
Someone on your team spends hours every week building reports manually
They log into Google Ads. Then Meta. Then the CRM. Then a spreadsheet. They copy numbers, paste them somewhere else, format it all into something presentable, and send it round. By the time it lands, it is already out of date. Your business reporting and KPI reporting should not depend on someone manually assembling a spreadsheet every Monday morning. If you could automate reporting, that person gets their week back.
You cannot answer simple questions about your business
Which channel is actually driving revenue? What is the real cost per acquisition, not just cost per click? Are we on track this month? Most businesses cannot answer these without pulling data from five places and hoping the numbers match up. The data exists but nobody is turning it into actionable insights. A reporting dashboard fixes that. A custom dashboard makes it permanent.
Your Google Sheets dashboard is held together with tape
It started as a quick spreadsheet. Then someone added a formula. Then another tab. Now it is 30 tabs deep, it breaks when someone accidentally edits the wrong cell, and nobody trusts the numbers anymore. A Google Data Studio dashboard or Looker Studio setup was the next attempt, but that did not quite do what you needed either.
AI Powered KPI Dashboards Built for Your Business
Every dashboard I build is a bespoke web application, not a template with your logo on it. Here are the types of dashboards I build most often. Each one connects to your actual data sources and displays the metrics you care about in real time.
Sales Dashboards
Pipeline value, conversion rates, deal velocity, and revenue by rep or region. A sales dashboard connects your CRM to your ad platforms so you can see which campaigns are actually driving closed deals, not just clicks. I built exactly this for a marketing agency, merging HubSpot CRM data with Google Ads, Meta, and LinkedIn spend data.
Marketing Dashboards
Campaign ROI, ad spend by channel, cost per lead, and marketing attribution across every platform you run. A marketing dashboard stops you guessing which channel is working and starts showing you actual marketing ROI. I find that most businesses have the data already. It is just trapped in ten different tabs. A digital marketing dashboard pulls it all together so you can make data driven marketing decisions based on actual numbers, not gut feel. This is marketing analytics and campaign reporting in one view.
Financial Dashboards
Revenue, cash flow, P&L, and forecasting in one view. A financial dashboard connects your accounting software, your CRM, and your ad platforms so you can see the full picture. A revenue dashboard that shows where the money is actually coming from, not just what the invoicing system says, is what most finance teams are missing.
CRM Dashboards
Lead tracking, pipeline stages, customer lifetime value, and sales activity. A CRM dashboard pulls your HubSpot, Salesforce, Pipedrive, or GoHighLevel data into a clean view that shows you what your pipeline actually looks like. It is just API calls at the end of the day. If you can do one CRM, you can do all of them.
Operations Dashboards
Team KPIs, project status, resource utilisation, and business health metrics. An operations dashboard gives you the performance dashboard your management team has been asking for. Instead of chasing updates in Slack, you open one page and everything is there.
Executive Dashboards
C suite overview: department statistics, overall revenue against targets, and the numbers that drive board decisions. An executive dashboard strips away the noise and gives leadership exactly the management reporting and board reporting they need. Revenue intelligence, pipeline health, and whether the business is on track. Nothing else.
Agency Client Dashboards
White label reporting with client logins in your agency branding. An agency dashboard where each client sees only their own data, with marketing reporting updated automatically, is a selling point for new business and a time saver for your team. No more building the same report twelve times a month. White label dashboard builds look like your product, not a third party tool. For any data driven marketing agency, this is how you scale client reporting without scaling headcount.
Competitive Intelligence Dashboards
Competitor monitoring, market share tracking, pricing data, and market intelligence. A competitive intelligence dashboard scrapes and monitors your competitors' metrics compared to yours. It is similar to the data that goes into an SEO audit, but displayed as a live view you can check any time instead of a one off report.
Need something that is not on this list? If it has an API, I can connect it. Book a discovery call and tell me what you need to see.
Is This Right for You?
Good fit
- Your data lives in five or more platforms and nobody has a unified dashboard view
- You are an agency that needs client reporting dashboards with logins and branding
- You have outgrown Google Sheets or Looker Studio and need a SaaS dashboard that actually fits your business
- Someone on your team spends hours every week doing automated reporting that should be, well, automated
- You need an ecommerce dashboard, performance dashboard, or ROI dashboard that connects your ad spend to your actual revenue
Not a fit
- You are an enterprise with an internal BI team and existing data infrastructure
- You do not have any data sources to connect yet
- You just need a simple Google Sheets formula or a quick chart
- You want workflow automation, not data visualisation. For that, have a look at bespoke AI automation
How I Build Your Dashboard
Four steps from first conversation to a live dashboard you own. No templates, no platform lock in.
I find out what you need to see, who needs to see it, and what data you actually have. This is the consulting part. I map every platform you use, identify what data exists and where it lives, and work out the metrics that will actually help you make better decisions. As a data analytics consultant, I am not just asking what charts you want. I am asking what business questions you need answered.
I build the automated data pipelines that connect your sources. Google Ads, your CRM, your accounting software, your project management tool. Whatever has an API, I can pull from it. The pipelines run on a schedule so your data is always current without anyone touching anything. This is the bespoke automation layer that sits behind every dashboard. If your CRM data is a mess of duplicates and missing fields, I wrote about how to fix a CRM data mess with automation and the same principles apply here.
I design and build the dashboard to your exact specifications. Your branding, your colours, your layout, your metrics. It is a bespoke web application built with AI powered analytics tools, not a configured template. This is where AI makes the biggest difference. What used to take a traditional developer weeks now takes hours. You get fast iteration, you see progress quickly, and changes are not a two week dev cycle.
You own it. The code, the design, the data pipelines. I document everything, walk your team through it, and hand it over hosted on Vercel where anyone with the URL can access it. No recurring licence fees, no lock in. If you need changes down the line, I am here. But you are not dependent on me to keep it running. This is dashboard as a service done properly: you pay once to build it, and it is yours.
Data Sources I Connect
As long as there is an API, I can make a dashboard. Here are the platforms I connect most often.
Ad Platforms
Google Ads, Meta Ads, LinkedIn Ads, TikTok Ads. Your Google Ads dashboard and PPC dashboard data in one place.
Analytics
Google Analytics 4, Google Search Console. Website traffic, conversions, and behaviour data feeding your AI analytics dashboard. This is where a web analytics service starts: connecting the data you already have.
CRM and Sales
HubSpot, Salesforce, Pipedrive, GoHighLevel, Zoho, Close. Pipeline, leads, and customer data for your CRM dashboard.
Finance
Xero, QuickBooks, Sage. Revenue, invoicing, and cash flow data for your financial dashboard builds.
Project Management
ClickUp, Notion, Asana, Monday.com, Airtable. Team performance and project status for operations dashboards.
Email and Outreach
Mailchimp, Klaviyo, Instantly, ActiveCampaign. Campaign performance and engagement metrics.
Social Media
Instagram, LinkedIn, Facebook, TikTok. Engagement, reach, and content performance for your social media dashboard.
Automation Layer
Make.com, n8n, Google Sheets, BigQuery. The data processing and pipeline tools that sit behind the scenes.
Why AI Changes Everything About Dashboard Builds
I use AI to build your dashboard faster, cheaper, and with more flexibility than a traditional developer or a data visualisation consultant. Here is what that actually means in practice.
Traditionally, a custom dashboard build could take weeks or months. With AI reporting and AI powered analytics tools, I build the same thing in a fraction of the time. That is not marketing speak. The Wonderwork dashboard was a complex multi source build with data from Google Ads, Meta, LinkedIn, and HubSpot, and it was built and iterated on rapidly using AI code generation. AI powered reporting is not just faster. It is a different category of speed.
You see something and want it changed? With a traditional developer, that is a ticket, a sprint, and two weeks of waiting. With my process, you tell me what you want different and I iterate on it the same day. That is the real value of an AI powered dashboard build. The feedback loop is tight enough that you actually get what you want instead of settling for "close enough".
Power BI and Tableau charge you monthly forever. I charge you once to build the dashboard, and you own it. No licence fees. No platform lock in. No surprise price increases. For businesses that want AI business intelligence built once and owned permanently rather than rented monthly, this is the model that makes sense. I can also connect AI agents to feed live data into your dashboard, surface business insights automatically, and turn raw numbers into marketing intelligence you can actually act on.
Why Work with a Dashboard Consultant
Most dashboard projects fail not because the technology is wrong, but because nobody understood the business problem properly first. That is where a consulting background matters.
Five years in corporate consulting at BAE Systems taught me to translate between technical teams and business leaders. When you tell me you need a dashboard, I do not just ask what charts you want. I ask what decisions you are trying to make and work backwards from there. A data visualisation service that cannot do that is just building pretty pictures.
APIs update, platforms add restrictions, new data sources emerge. What worked six months ago might not work today. I stay on top of all of it so you do not have to. That is the difference between a one off template setup and working with someone who builds custom reporting dashboards as their core service.
Looker Studio is harder to use than you think and it does not look very good. My dashboards look amazing. They are fully customised, built from the ground up, doing exactly what the client wants. That is the difference. You are not getting a template tool configured. You are getting a real time dashboard application built specifically for your business.
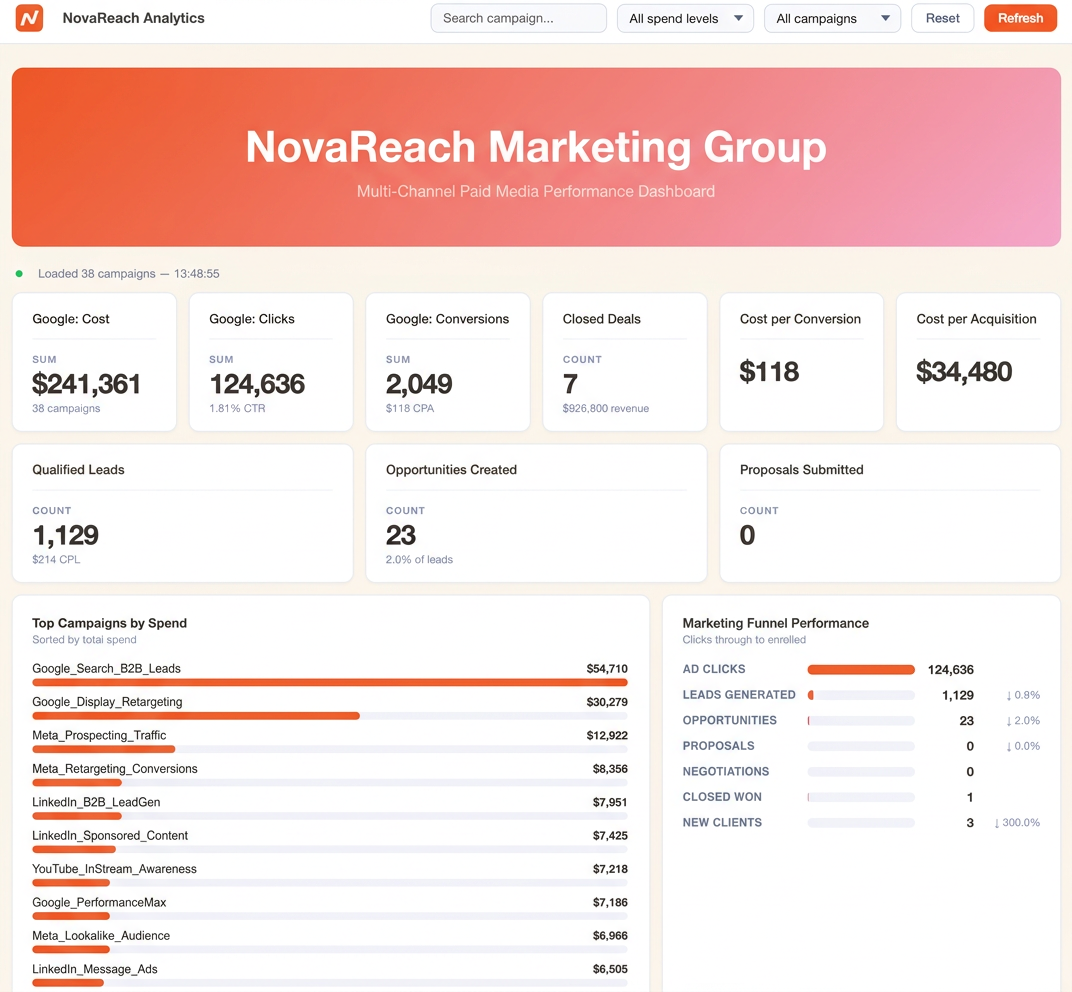
Real Builds, Not Mockups
A screenshot from a real client dashboard build. This is a multi source marketing intelligence dashboard pulling data from Google Ads, Meta, LinkedIn, and HubSpot.
What Clients Say
"From our very first conversation, it was clear that he is an expert in his field. He took the time to thoroughly understand our business, the use case, and the specific data we needed, as well as the reasoning behind it. Throughout the project, Josh consistently suggested the best way forward. Even when we overlooked something, he was already a step ahead, ensuring nothing was missed. Finding someone you can trust with projects of this nature, who not only delivers exceptional results but also makes the process clear and collaborative, is rare."Xen, Wonderwork Digital
Frequently Asked Questions
What is an AI dashboard?
An AI dashboard is a bespoke web application that pulls data from multiple platforms via API and displays it in one live view. The AI part is how it gets built. I use AI to write the code, process the data, and iterate on designs in hours instead of weeks. The result is a fully custom dashboard in your branding that updates automatically and shows exactly the metrics you need.
What is a KPI dashboard?
A KPI dashboard is a single screen that shows your most important business metrics in real time. Revenue, conversion rates, pipeline value, ad spend, whatever numbers actually drive your decisions. Instead of logging into five different platforms to check how things are going, you open one page and everything is there. The best KPI dashboards are built around what your business specifically needs to track, not what a template tool decides to show you.
What is business intelligence?
Business intelligence means turning raw data into something you can actually make decisions with. Most businesses have the data already. It is sitting in their CRM, their ad platforms, their accounting software, and their spreadsheets. The problem is nobody has pulled it all together into a view that tells you what is working and what is not. That is what a business intelligence dashboard does.
Can you build a Google Analytics dashboard?
Yes. Google Analytics has a well documented API and I can pull traffic, conversion, and behaviour data into a custom dashboard alongside data from your other platforms. The advantage over using GA4 directly is that you see your analytics data next to your ad spend, your CRM data, and your revenue numbers in one view instead of switching between tabs.
Can you replace my Google Sheets dashboard?
Yes, and I have done exactly this. One of my builds used Google Sheets as the data processing layer with automated pipelines feeding data in, then displayed everything in a custom branded dashboard. If you have outgrown a Google Sheets dashboard and want something that looks professional, updates automatically, and does not break when someone accidentally edits a formula, a bespoke build is the right next step.
Can you build a dashboard for my agency's clients?
Yes. An agency dashboard with client logins is one of the most requested builds. Each of your clients gets their own login and sees only their own data. You stop building the same report twelve times a month. The dashboard is white label reporting in your agency branding, so it looks like your product, not a third party tool. It becomes a selling point for new clients too.
Can you connect Google Ads data?
Yes. Google Ads is one of the most common data sources I connect. The Google Ads dashboard view shows spend, impressions, clicks, conversions, and cost per acquisition alongside your CRM data so you can see which campaigns are actually driving revenue, not just clicks. PPC reporting across Google, Meta, and LinkedIn in one place means you stop switching between tabs and start seeing the full picture. I connect any ad platform with an API.
Can you build an SEO dashboard?
Yes. An SEO dashboard typically pulls data from Google Search Console, Google Analytics, and tools like Ahrefs or SEMrush. It shows keyword rankings, organic traffic, click through rates, and conversion data in one place. If you want a full SEO strategy alongside the dashboard, have a look at my SEO audit service.
Can you build a social media dashboard?
Yes. A social media dashboard pulls engagement, reach, follower growth, and content performance data from platforms like Instagram, LinkedIn, Facebook, and TikTok. If the platform has an API, I can connect it. The value is seeing all your social channels side by side instead of logging into each one separately.
Do you just build the dashboard or do you help with data analysis?
Both. I do not just plug your data into a screen and walk away. The discovery phase is about understanding what business insights you actually need, not just what metrics look good on a chart. That means working with you on which numbers matter, how they relate to each other, and what the data is telling you about your marketing analytics and business performance. The dashboard is the output. The thinking behind it is the real value.
Can you set up marketing attribution tracking?
Yes. Marketing attribution is one of the hardest problems in digital marketing and one of the most valuable things a dashboard can solve. I connect your ad platforms to your CRM so you can track the full journey from ad click to closed deal. For businesses with longer sales cycles, multi touch attribution shows you every touchpoint that contributed to the sale, not just the last click. This is exactly what I built for Wonderwork Digital, where the education client had 180+ day sales cycles and the data was spread across Google, Meta, LinkedIn, and HubSpot.
How much does a custom dashboard cost?
Every build is scoped and priced individually because no two dashboards are the same. A focused single source dashboard is less than a multi source build with user logins and role based access. I always scope the work before quoting so you know exactly what you are getting. There are no recurring licence fees and no platform lock in. You own what I build. Check my pricing page for typical ranges.
How long does it take to build?
A focused dashboard with one or two data sources can be live within one to two weeks. Multi source builds with user authentication, role based access, and complex metrics take three to four weeks. The AI tools I use mean what used to take months now takes weeks, and what used to take weeks now takes days.
Do I need Power BI or Tableau?
Probably not, and that is exactly why this service exists. Power BI and Tableau are template tools that you configure. They are powerful, but you are always working within their constraints. What I build is a bespoke web application from scratch, fully customised to your business, your branding, and your exact requirements. No licence fees, no platform lock in, and it does exactly what you need instead of approximately what you need. If you are looking for a Power BI alternative or a Tableau alternative that is actually built for your business, this is it.
Stop Guessing. Start Seeing Your Data.
Book a call and tell me what you need to see. I will look at your data sources, your current setup, and tell you straight what a bespoke AI dashboard would look like for your business. If you are curious about pricing, that is on the call too.
Book a Discovery Call